Exploring the implications of sample size on the Central Limit Theorem, this article highlights how skewed distributions can demand larger samples for reliable results.
Sample Size and the Central Limit Theorem
The Central Limit Theorem (CLT) is often an essential concept in statistics, asserting that as sample sizes increase, the distribution of sample means will approach a normal distribution. However, the practicality of this theorem hinges on the nature of the underlying distribution, especially when it is skewed. A recent comment by Frank Harrell on BlueSky emphasized a significant insight: "At the heart of the failure of the CLT is its need for the mean and standard deviation to be independent. With asymmetric distributions, they are far from independent. N=50,000 may be far too small for the CLT to work well enough." This statement begs the question: how large does your sample size need to be for the CLT to yield useful results?
Insights from Simulations
To gain a better understanding, I conducted simulations using R, manipulating sample sizes and distribution types to observe how well the sample means aligned with normality. The simulations were powered by a function designed to repeatedly sample from a population, calculate mean values, and assess their distribution characteristics.
The core functionality of the sim_clt() function included generating a specified number of samples from a given population, calculating means, and producing diagnostic measures like the Anderson-Darling statistic and the coverage of confidence intervals. This way, I could objectively evaluate how the distribution of sample means conformed to normality.
Testing Different Sample Sizes
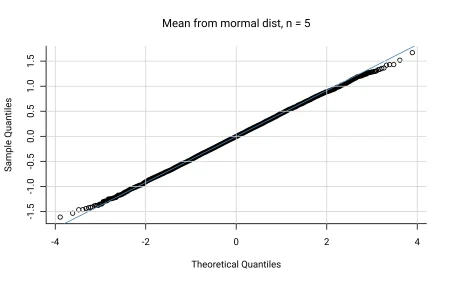
My initial exploration involved a standard normal distribution, examining how sample sizes impacted the behavior of the means. Interestingly, using a sample size of just five, I discovered that while the resulting distribution of sample means showed a tendency toward normality, it fell short of the expected performance associated with larger samples. When simulating with a sample size of 100 from a log-normal distribution, the normality was even less pronounced.
The specific findings illustrated a clear trend: even as we pushed sample sizes up to 100 or more, the skewed nature of the parent distribution significantly affected the stability and reliability of our sample mean's normality. This observation led me to further investigate how different population distributions would respond across a spectrum of sample sizes.
Diverse Distribution Effects
For a comprehensive analysis, I explored a variety of distributions, including log-normal, Cauchy, Pareto, and mixtures of normal and exponential distributions. Each distribution was subjected to multiple sample sizes ranging from 5 to 40,000. The results were enlightening, particularly when I explored the coverage of confidence intervals, which is often of utmost concern in inferential statistics.
- Standard normal distribution: This behaved as expected, maintaining normality across sample sizes.
- Log-normal distributions: Both standard and high variance demonstrated poor alignment to normality with smaller samples.
- Cauchy distribution: No matter the size, the sample means did not converge toward a normal distribution, highlighting one of the CLT’s notable limitations.
- Pareto distribution: Challenging, requiring large sample sizes to achieve some semblance of normality in the sample means.
- Mixtures of normal distributions: Showed a troubling performance, often failing to adhere to expectations without appropriately large samples.
Interpreting the Results
The analysis revealed that for skewed distributions like log-normal and Pareto, the sample sizes necessary for the central limit theorem to hold sway could reach into the thousands. Coverage statistics for confidence intervals indicated that without sufficiently large samples, many confidence intervals derived from these distributions fell significantly short of the desired 95% coverage, often yielding results as low as 80% or even less.
In particular, insights drawn from the Anderson-Darling statistics further rationalized these observations: the divergence from normality became pronounced as sample sizes became smaller, especially with populations exhibiting heavy tails or significant skewness. The Cauchy distribution notably recorded an Anderson-Darling statistic that illustrated its failure to meet normality, no matter the sample size approached.
Final Thoughts
What does all this mean for practitioners relying on the Central Limit Theorem? Essentially, those venturing into analyses with small or skewed samples should proceed with caution. As Harrell suggested, reliance on the CLT—and particularly its assumptions—can be misleading unless sample sizes are adequate. The call to arms is clear: sampling from challenging distributions demands attention to size to ensure that statistical inferences are both valid and reliable.
As statisticians and data analysts, understanding the nuances of distribution behavior becomes pivotal. The push for larger sample sizes isn't merely a formality but rather a best practice, ensuring that the conclusions drawn are substantial and robust. Therefore, when navigating complex statistical waters, one must be aware of underlying distribution shapes and their implications for sample size requirements.



Discussion
Sign in to join the discussion.