Discover how skewness can improve your portfolio strategy by identifying mispriced assets and optimizing returns using R.
Understanding Skewness in Portfolio Management
While conventional portfolio strategies often rest on mean-variance analysis or factor-based models, recent findings underscore the pivotal role of skewness—the third statistical moment—in affecting asset returns. Investments exhibiting high positive skewness tend to represent overpriced lottery-like payoffs, while assets with negative skewness are frequently undervalued. A thorough 66-page study illustrates that portfolios managed with skewness considerations can significantly outperform traditional approaches, particularly during brief and volatile periods. This indicates that understanding skewness isn't just an academic exercise; it's a practical necessity for portfolio managers.
The Importance of Skewness
Skewness offers insights that go beyond mere averages and variances. Here's the significance:
- Identifying Tail Risks: Skewness quantifies the asymmetry in return distributions, providing a clear view of whether extreme gains or losses are more likely. In volatile markets, these tail risks can dramatically impact overall portfolio performance, making skewness an essential focus for risk-conscious investors.
- Behavioral Insights: Investors frequently flock to assets that resemble lottery tickets, a phenomenon leading to persistent mispricing within the market. This behavioral tendency means that assets with favorable skewness can become inflated in price, pushing them beyond fundamental valuations.
- Performance Evidence: Empirical studies show that portfolios structured around skewness metrics typically achieve superior Sharpe ratios, especially during economic downturns or periods of high volatility. This performance metric indicates how much return an investor can expect per unit of risk, further supporting the case for skewness management.
Methodological Framework
The strategy for managing skewness in a portfolio is deceptively simple yet effective. It entails:
- Calculating the skewness of asset returns over a designated short time frame, providing a snapshot of the distribution's shape.
- Ranking the assets based on their skewness scores, allowing investors to identify which ones are more likely to produce significant returns.
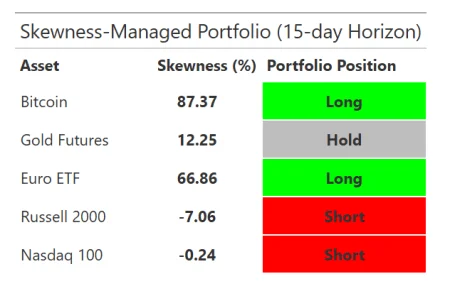
- Going long on the top two assets, short on the bottom two, and holding the remaining assets. This tactical allocation reflects a strategic response to perceived risks and rewards.
This straightforward approach is backed by strong empirical support across various market anomalies, factor models, and different macroeconomic conditions. It’s not just theory; actual market performance validates it.
Implementing the Strategy in R
For those looking to apply the skewness management strategy in practice, here's a reproducible code snippet utilizing tidyverse, tidyquant, and gt, enabling the construction of a skewness-managed portfolio:
# Load necessary libraries
library(tidyverse)
library(tidyquant)
library(timetk)
library(moments)
library(gt)

# 1. Set the desired asset symbols
symbols <- c("BTC-USD", "GC=F", "QQQ", "IWM", "IEUR")

# 2. Gather about three years of daily asset data
df <- tq_get(symbols,
from = Sys.Date() - 1095,
to = Sys.Date(),
get = "stock.prices") %>%
group_by(symbol) %>%
mutate(ret = log(adjusted) - log(lag(adjusted))) %>%
drop_na()

# 3. Prepare the data: last 15 days as test data
split <- time_series_split(df, assess = 15, cumulative = TRUE)
train_data <- training(split)
test_data <- testing(split)

# 4. Calculate skewness over the testing period
skew_scores <-
test_data %>%
group_by(symbol) %>%
summarise(skewness = moments::skewness(ret, na.rm = TRUE))

# 5. Determine portfolio positions based on skewness
positions <-
skew_scores %>%
mutate(position = case_when(
rank(-skewness) <= 2 ~ "Long",
rank(skewness) <= 2 ~ "Short",
TRUE ~ "Hold"
))

# 6. Build a visually appealing gt table to present the results
positions %>%
mutate(skewness_pct = round(skewness * 100, 2)) %>%
mutate(asset_name = case_when(
symbol == "BTC-USD" ~ "Bitcoin",
symbol == "GC=F" ~ "Gold Futures",
symbol == "IEUR" ~ "Euro ETF",
symbol == "IWM" ~ "Russell 2000",
symbol == "QQQ" ~ "Nasdaq 100",
TRUE ~ symbol
)) %>%
select(asset_name, skewness_pct, position) %>%
gt() %>%
tab_header(title = "Skewness-Managed Portfolio (15-day Horizon)") %>%
cols_label(asset_name = "Asset",
skewness_pct = "Skewness (%)",
position = "Portfolio Position") %>%
tab_style(
style = cell_text(weight = "bold"),
locations = cells_column_labels(columns = everything())
) %>%
tab_style(
style = cell_text(align = "left"),
locations = cells_column_labels(columns = vars(asset_name))
) %>%
tab_style(style = cell_fill(color = "green"),
locations = cells_body(columns = vars(position), rows = position == "Long")) %>%
tab_style(style = cell_fill(color = "red"),
locations = cells_body(columns = vars(position), rows = position == "Short")) %>%
tab_style(style = cell_fill(color = "gray"),
locations = cells_body(columns = vars(position), rows = position == "Hold")) %>%
tab_style(style = cell_text(align = "center", weight = "bold"),
locations = cells_body(columns = vars(skewness_pct, position))) %>%
tab_style(style = cell_text(align = "left"),
locations = cells_body(columns = vars(asset_name))) %>%
tab_style(style = cell_borders(sides = "all", color = "white", weight = px(2)),
locations = cells_body(columns = everything()))
Implications of Skewness in Portfolio Strategies
The implications of integrating skewness into portfolio management are far-reaching. If you're working in this space, consider how this analytical lens shifts your understanding of risk and reward dynamics. Firstly, skewness highlights the importance of managing tail risks effectively. Investors typically focus on average returns, but neglecting skewness can expose portfolios to outsized risk during market turmoil.
What this means for you is that skewness can inform not just the choice of assets but also timing and market behavior predictions. For instance, during economic uncertainties—where volatility prevails—incorporating skewness could provide the insight necessary to enhance performance. (And this is the part most people overlook). A conventional focus on mean-variance analysis often sends investors chasing trends instead of focusing on the underlying distributions of returns.
Final Thoughts
Utilizing skewness in portfolio management offers a methodologically sound approach to tapping into the asymmetries present in asset returns. The simplicity of this rule matches its empirical validation across varied market conditions, making it more than just an academic concept. For traders focused on short-term, high-frequency, and volatile strategies, skewness management can be a useful addition to their investment framework. It’s a clear invitation to reevaluate how we perceive risk and expected returns.
R-bloggers.com offers daily updates on R news, tutorials, and data science jobs. Click here if you want to post or find an R/data-science job.
Want to share your content on R-bloggers? click here if you have a blog, or here if you don't.



Discussion
Sign in to join the discussion.